Sunday, 21 April 2024
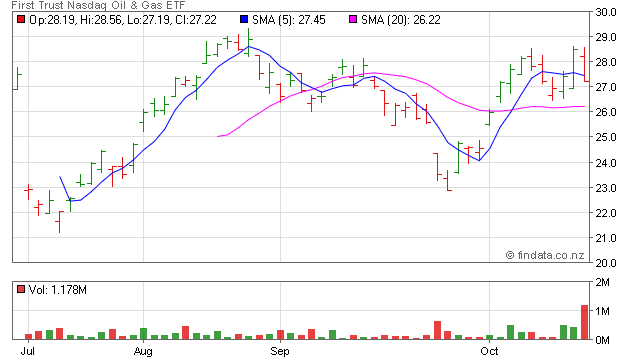
First Trust Nasdaq Oil & Gas ETF
NASDAQ : FTXN
27.22
14 Oct 22 00:00 | Change:
 1.25 1.25 | Open:
28.19 | High:
28.56 | Ask:
0.00 | Volume:
1,178,200 |
Change(%):
4.39 | Prev:
28.47 | Low:
27.19 | Bid:
0.00 | Avg vol:
0 |
Murphy Oil Corp 200 Day Moving Average Chart. Looking at the chart above, MUR's low point in its 52 week range is $22.21 per share, with $35.16 as the 52 week high point - that compares with a last trade of $26.16.
more»The chart below shows the one year performance of VLO shares, versus its 200 day moving average: Valero Energy Corp 200 Day Moving Average Chart.
more»Looking at a chart of one year performance (below), PSX's low point in its 52 week range is $75.135 per share, with $107.47 as the 52 week high point - that compares with a last trade of $94.62.
more»PBF Energy Inc shares are currently trading off about 1.8% on the day. PBF Energy Inc 1 Year Performance Chart. According to the ETF Finder at ETF Channel, PBF makes up 3.52% of the First Trust Nasdaq Oil & Gas ETF (Symbol: FTXN) which is trading lower ...
more»... trade of $50.67. EQT Corp shares are currently trading down about 2.4% on the day. EQT Corp 1 Year Performance Chart. According to the ETF Finder at ETF Channel, EQT makes up 4.10% of the First Trust Natural Gas ETF (Symbol: FCG) which is trading ...
more»
There are currently no comments on this topic.
Be the first person to Add a Comment...
You must be a registered user to post a comment: REGISTER NOW
If you are already registered, please LOGIN NOW
|
| Code | Last | Change |
|---|
| COMP | 10,321 | 328 | | 3.08% |
| DJI | 29,635 | 404 | | 1.34% |
| SP500 | 3,583 | 87 | | 2.37% |
| DAX | 12,438 | 82 |  | 0.67% |
| FTSE | 7,488 | 5 | | 0.07% |
| NI225 | 22,420 | 408 | | 1.86% |
| TWI | 67.27 | 0.00 |  | 0.00% |