Saturday, 20 April 2024
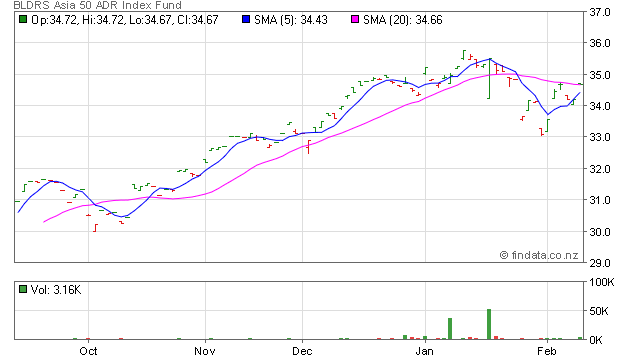
BLDRS Asia 50 ADR Index Fund
NASDAQ : ADRA
34.67
11 Feb 20 00:00 | Change:
 0.48 0.48 | Open:
34.72 | High:
34.72 | Ask:
36.00 | Volume:
3,160 |
Change(%):
1.39 | Prev:
34.19 | Low:
34.67 | Bid:
33.00 | Avg vol:
0 |
The chart below shows the one year performance of MTU shares, versus its 200 day moving average: Mitsubishi UFJ Financial Group Inc 200 Day Moving Average Chart.
more»Westpac Banking Corp shares are currently trading up about 0.8% on the day. The chart below shows the one year performance of WBK shares, versus its 200 day moving average: Westpac Banking Corp 200 Day Moving Average Chart.
more»The chart below shows the one year performance of DCM shares: NTT DoCoMo Inc 1 Year Performance Chart. Looking at the chart above, DCM's low point in its 52 week range is $22.50 per share, with $26.14 as the 52 week high point - that compares with a ...
more»... chart below shows the one year performance of SHG shares, versus its 200 day moving average: Shinhan Financial Group Co. Ltd. 200 Day Moving Average Chart.
more»01:00 | 15/11/17
Seeking Alpha
There are 35 ETFs and ETNs on Deathwatch this month that have been on the market for more than 10 years. That is a long time to wait for investor interest to kick in.
more»
There are currently no comments on this topic.
Be the first person to Add a Comment...
You must be a registered user to post a comment: REGISTER NOW
If you are already registered, please LOGIN NOW
|
| Code | Last | Change |
|---|
| COMP | 10,321 | 328 |  | 3.08% |
| DJI | 29,635 | 404 | | 1.34% |
| SP500 | 3,583 | 87 | | 2.37% |
| DAX | 12,438 | 82 | | 0.67% |
| FTSE | 7,488 | 5 | | 0.07% |
| NI225 | 22,420 | 408 | | 1.86% |
| TWI | 67.27 | 0.00 |  | 0.00% |