
Advertisement
Advertisement
Will Brexit Make or Break the British Pound?
Updated: Mar 20, 2018, 10:44 UTC
Fundamental View The USD is becoming weaker against the majority of main currencies despite the fact that FED is expected to raise interest rates this
Fundamental View
The USD is becoming weaker against the majority of main currencies despite the fact that FED is expected to raise interest rates this Wednesday, 21st of March, thus, strengthening this popular currency. There is no doubt that probably this incident will take most investors out of their comfort zone and, in the short-term may create uncertainty in the market.
While opinions are giving and taking on, regarding what is really behind the USD moves, it could be noticed that the Break British Pound seems to start gaining momentum. It should be highlighted that on Monday, 19th March 2018, the GPB was distinguished as the best-performing currency. These moves could be a “side effect” of the Brexit negotiation reports which had a positive outcome over the last weekend.
Regarding Brexit, the EU and the UK tend to agree in the most parts of the negotiation procedure. Moreover, EU citizens who relocate to the UK will not be affected during the transition period (March 2019- December 2020). Therefore, investors expect that the GBP might be more stable.
For the rest of the week, we will have some exciting moments from the UK including the inflation rate, retail sales, and employment data announcements, which seem to be significant data to influence the UK Monetary Policy. Furthermore, the UK consumer price index may probably lead to a rise of the GBP, a nice boost along with other factors that have been presented above.
Technical View
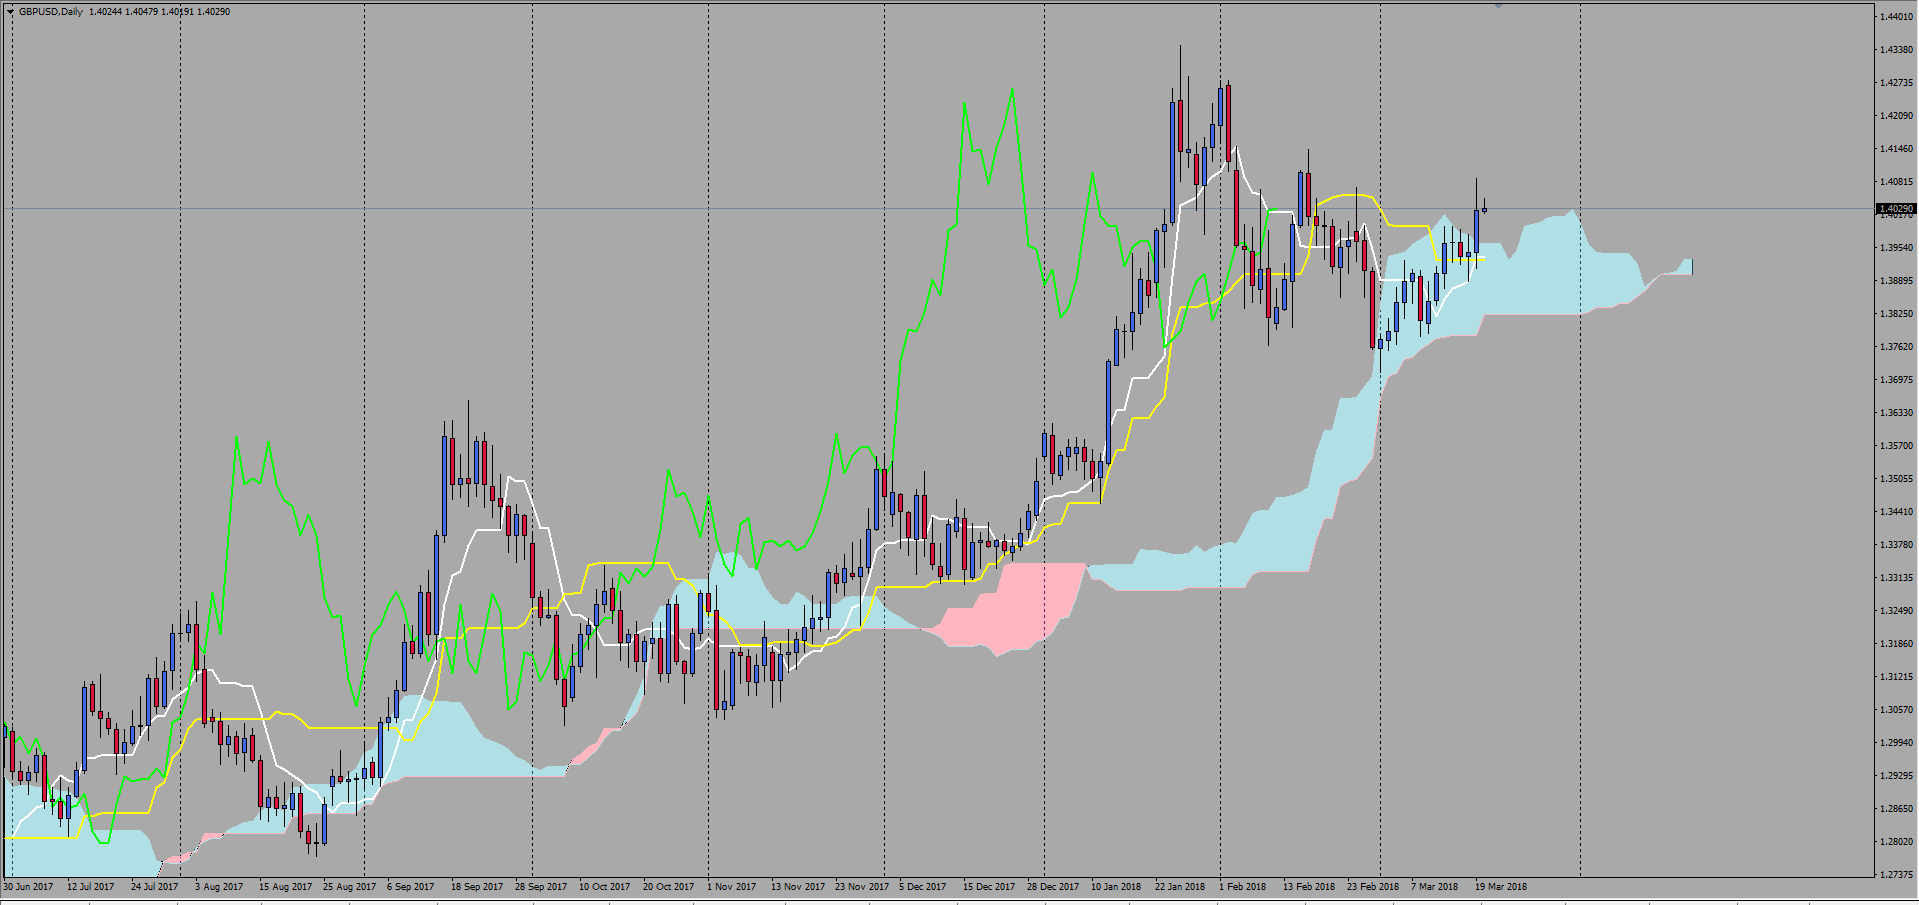
GBPUSD Daily Time Frame
It could be noted that the GBP/USD fundamental analysis aligns with the technical analysis. In addition, it could be inferred that the recent weakness of the USD is applied in this chart too, giving the GBP probably another boost.
We may see that probably we are on an uptrend. This can be justified, if for example, we examine the Ichimoku components we may state that the price and the lines Kijun Sen, Tekan Sen and Chickou Span are above the span B of the cloud, as well as, the cloud is aggressively up.
The lines seem to form a crossover formation which probably will be the first clue of a breakout signal. Nevertheless, by having the second part and signal confirmation, we may see that the lines cross in the opposite direction, which means that the lines may come to a bullish formation once more (Kijun Sen-yellow line below the Tekan Sen-white line).
GBP/USD 1H Time Frame
A possible way to enter this is to watch the 1H time frame and, if the price comes back to the Kijun Sen line, then you may consider going long.
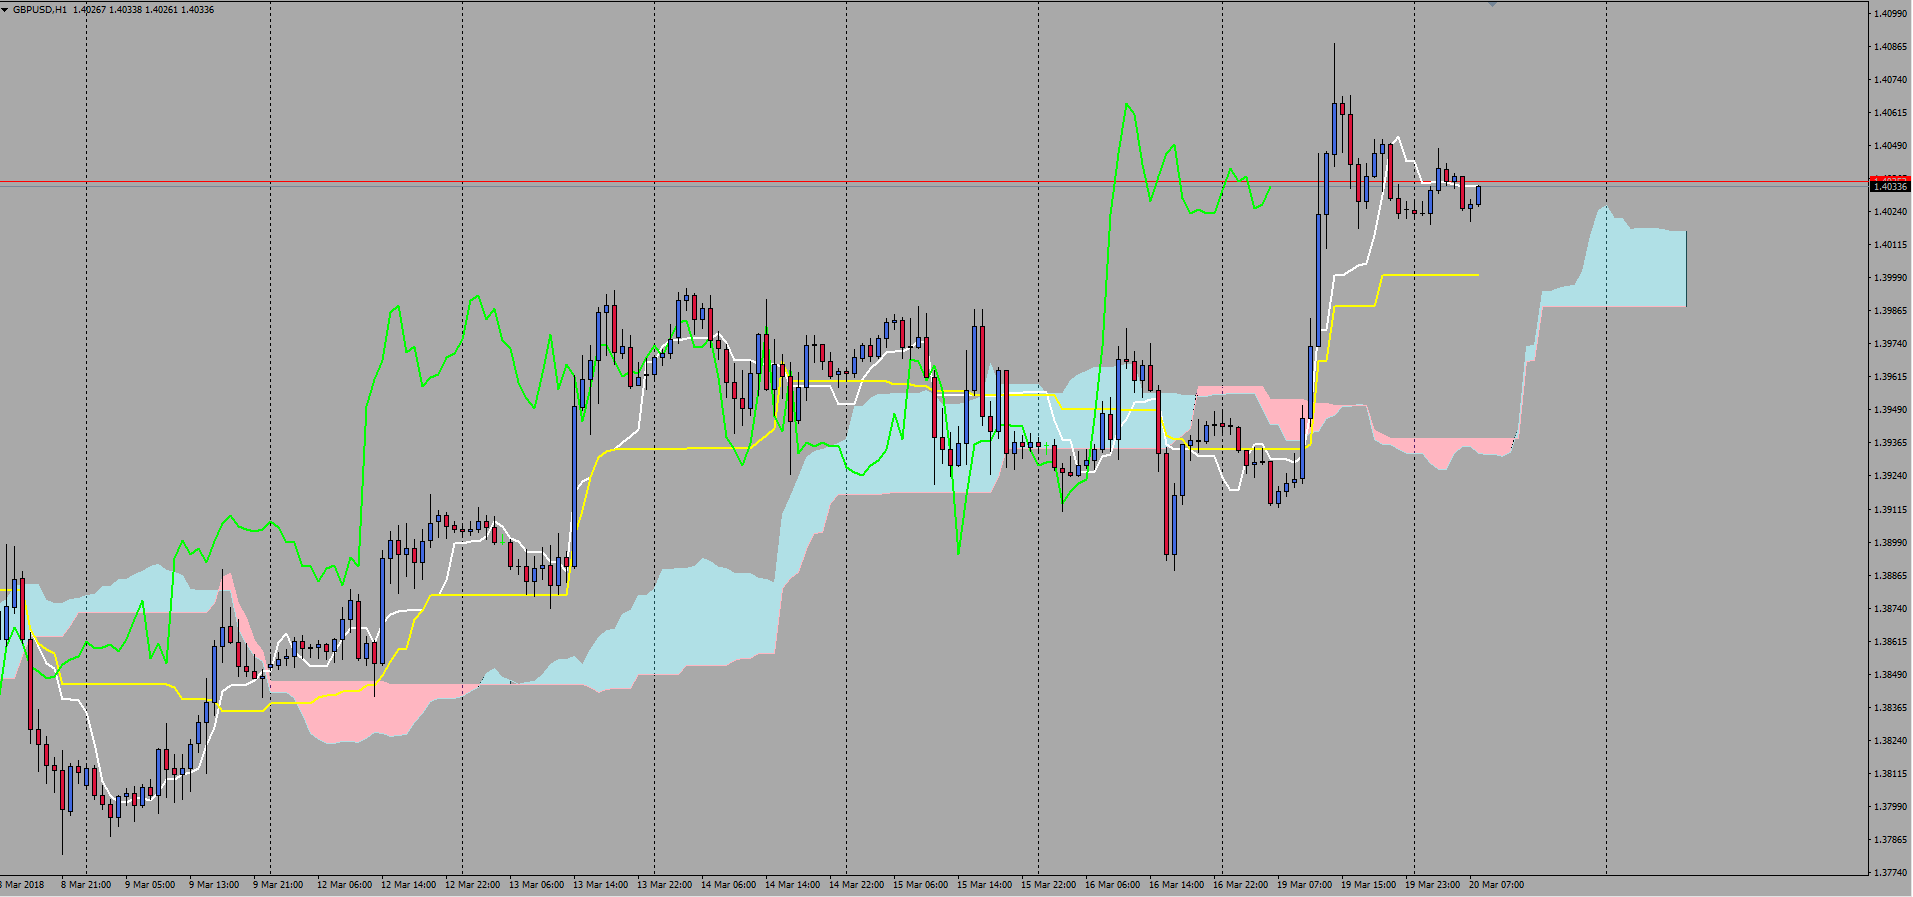
This week the GBP may be expected to volatile so be careful before entering the market. In addition to this, estimate the risk before taking into consideration any valid signal.
This article was written by Marios Athinodorou, TeleTrade’s market analyst, and commentator. Among others, Marios is delivering weekly trading webinars. Sign up for upcoming webinars here.
About the Author
Marios Athinodoroucontributor
Did you find this article useful?
Latest news and analysis


Advertisement