

Form 497K RYDEX ETF TRUST
 Tweet
Tweet Share
Share
RYU | Exchange Traded Funds | | | 2.28.2018 | |||
Guggenheim ETFs Summary Prospectus | ||||||
NYSE ARCA, Inc. Ticker Symbol | Fund Name |
RYU | Guggenheim S&P 500® Equal Weight Utilities ETF |
Before you invest, you may wish to review the Fund’s Prospectus, which contains more information about the Fund and its risks. You may obtain the Prospectus and other information about the Fund, including the Statement of Additional Information (SAI) and most recent reports to shareholders, at no cost by visiting guggenheiminvestments.com/services/prospectuses-and-reports, calling 800.820.0888 or e-mailing [email protected]. The Fund’s Prospectus and SAI, both dated February 28, 2018, as revised from time to time, and the Fund’s most recent shareholder reports, are incorporated by reference into this Summary Prospectus.
SUMETFRYU-0218x0219 | guggenheiminvestments.com |
GUGGENHEIM S&P 500® EQUAL WEIGHT UTILITIES ETF (RYU)
INVESTMENT OBJECTIVE
The investment objective of the Guggenheim S&P 500® Equal Weight Utilities ETF (the “Fund”) is to replicate as closely as possible, before fees and expenses, the performance of the S&P 500® Equal Weight Index Telecommunication Services & Utilities Total Return (the “Underlying Index”).
FEES AND EXPENSES OF THE FUND
The table below describes the fees and expenses that you may pay if you buy and hold shares of the Fund. Most investors also will incur customary brokerage commissions when buying or selling shares of the Fund, which are not reflected in the table or the Example. If commissions were included in the table and the Example, the costs shown would be higher.
Shareholder Fees (fees paid directly from your investment) | None | |
Annual Fund Operating Expenses (expenses that you pay each year as a percentage of the value of your investment) | ||
Management Fees | 0.40 | % |
Distribution (12b-1) Fees | 0.00 | % |
Other Expenses* | 0.00 | % |
Total Annual Fund Operating Expenses | 0.40 | % |
* Other Expenses were less than 0.01% for the fiscal year ended October 31, 2017.
EXAMPLE
This Example is intended to help you compare the cost of investing in the Fund with the cost of investing in other funds. The Example assumes that you invest $10,000 in the Fund for the time periods indicated and then redeem all of your shares at the end of those periods. The Example also assumes that your investment has a 5% return each year and that the Fund’s operating expenses remain the same. Although your actual costs may be higher or lower, based on these assumptions your costs would be:
1 Year | 3 Years | 5 Years | 10 Years |
$41 | $129 | $225 | $506 |
PORTFOLIO TURNOVER
The Fund pays transaction costs, such as commissions, when it buys and sells securities (or “turns over” its portfolio). A higher portfolio turnover rate may indicate higher transaction costs and may result in higher taxes when Fund shares are held in a taxable account. These costs, which are not reflected in the Total Annual Fund Operating Expenses or the Example, affect the Fund’s performance. During the most recent fiscal year, the Fund’s portfolio turnover rate was 11% of the average value of its portfolio. However, the Fund’s portfolio turnover rate is calculated without regard to cash instruments, most derivatives and securities received or delivered as a result of in-kind creations and redemptions of the Fund’s shares. If such instruments were included, the Fund’s portfolio turnover rate might be significantly higher.
PRINCIPAL INVESTMENT STRATEGIES
The Fund invests primarily in equity securities to meet its investment objective of replicating the Underlying Index as closely as possible, before fees and expenses. The Underlying Index is an unmanaged equal weighted version of the S&P 500® Utilities Index that consists of common stocks of companies that comprise the Utilities Sector and Telecommunication Services Sector of the S&P 500® Index. The Utilities Sector includes utility companies such as electric, gas and water utilities. It also includes independent power producers and energy traders and companies that engage in generation and distribution of electricity using renewable sources. The Telecommunication Services Sector includes companies that provide communications services primarily through a fixed-line, cellular or wireless, high bandwidth and/or fiber optic cable network. As of December 31, 2017, the Underlying Index included companies with
1 | SUMMARY PROSPECTUS
a capitalization range of $5.7 billion to $238.7 billion. In general, the equal weighting provided by the Underlying Index provides equal representation for all securities at the Underlying Index’s rebalance interval(s), thereby providing broader exposure to the majority of securities in the Underlying Index than typically may be found in the Underlying Index’s market capitalization weighted counterpart.
The Fund uses a passive management strategy, known as “replication,” to track the performance of the Underlying Index. “Replication” refers to investing in substantially all of the securities in the Underlying Index in approximately the same proportions as in the Underlying Index. Under normal circumstances, the Fund will invest at least 90% of its net assets, plus any borrowings for investment purposes, in the equity securities included in the Underlying Index. The Advisor expects that, over time, the correlation between the Fund’s performance and that of the Underlying Index, before fees and expenses, will be 95% or better. A figure of 100% would indicate perfect correlation. The Advisor monitors the Fund’s tracking of the Underlying Index and seeks to maintain an appropriate correlation. The Advisor rebalances the Fund’s portfolio at the same rebalance interval(s) utilized by the Underlying Index.
As long as the Fund invests at least 90% of its total assets in securities included in the Underlying Index, the Fund may hold up to 10% of its assets in securities not included in the Underlying Index, futures contracts, options on futures contracts, options, and swaps related to the Underlying Index, as well as cash and cash equivalents, and shares of investment funds, including money market funds. On a day-to-day basis, the Fund may also hold repurchase agreements, U.S. Government securities or cash equivalents to collateralize its derivatives positions. In an effort to make sure the Fund is fully invested on a day-to-day basis, the Fund may conduct any necessary trading activity at or just prior to the close of the U.S. financial markets.
To the extent the Underlying Index is concentrated in a particular industry the Fund will necessarily be concentrated in that industry. As of December 28, 2017, the Fund has significant exposure to the Utilities Sector and Telecommunication Services Sector, as each sector is defined by the Global Industry Classification Standard, a widely recognized industry classification methodology developed by MSCI, Inc. and Standard & Poor's Financial Services LLC. Also, as of December 28, 2017, the Underlying Index components and thus the Fund's investments, are concentrated (i.e., 25% or more of its assets) in securities issued by companies in the Electric Utilities Industry and the Multi-Utilities Industry, separate industries within the Utilities Sector. The industries or groups of related industries in which the Underlying Index components, and thus the Fund's investments, may be concentrated will vary as the composition of the Underlying Index changes over time. The Fund is non-diversified and, therefore, may invest a greater percentage of its assets in a particular issuer in comparison to a diversified fund.
PRINCIPAL RISKS
As with all exchange-traded funds, a shareholder is subject to the risk that his or her investment could lose money. In addition to this risk, the Fund is subject to a number of additional risks that may affect the value or liquidity of its shares, including:
Authorized Participant Concentration Risk—Only an Authorized Participant may engage in creation or redemption transactions directly with the Fund. The Fund has a limited number of institutions that serve as Authorized Participants. To the extent that these institutions exit the business or are unable to proceed with creation and/or redemption orders with respect to the Fund and no other Authorized Participant is able to step forward to create or redeem, Fund shares may trade at a discount to net asset value ("NAV") and possibly face delisting.
Correlation and Tracking Error Risk—A number of factors may affect the Fund’s ability to achieve a high degree of correlation with its Underlying Index, and there can be no guarantee that the Fund will achieve a high degree of correlation with its Underlying Index either on a single trading day or for a longer time period. Factors such as Fund expenses, imperfect correlation between the Fund’s investments and the components of the Underlying Index, rounding of share prices, changes to the composition of the Underlying Index, regulatory policies, a high portfolio turnover rate, and the use of leverage all contribute to tracking error and correlation risk. Failure to achieve a high degree of correlation may prevent the Fund from achieving its investment objective and cause the Fund's performance to be less than you expect.
Equity Risk—The Fund is subject to the risk that the value of the equity securities and equity-based derivatives, if any, in the Fund’s portfolio will decline due to volatility in the equity market caused by general market and economic conditions, perceptions regarding particular industries represented in the equity market, or factors relating to specific companies to which the Fund has investment exposure.
SUMMARY PROSPECTUS | 2
ETF Trading Risks—An unanticipated closing of the Exchange or one or more markets on which either the Fund’s shares trade or the Fund’s portfolio holdings trade or the inability of such markets to open for trading during normal business hours, such as in response to a natural disaster or other event causing severe market disruption, could result in a shareholder’s inability to buy or sell shares of the Fund and the Fund’s inability to buy and sell exchange-traded portfolio securities during that period, or in a disruption of the Fund’s creation and redemption process, and may make it difficult for the Fund to accurately price its investments thereby potentially affecting the price at which Fund shares trade in the secondary market. All of these events could adversely affect the performance of the Fund. Trading in Fund shares also may be halted by the Exchange or other markets because of market conditions or other reasons. If a trading halt occurs, a shareholder may temporarily be unable to purchase or sell shares of the Fund. Similarly, the Exchange or other markets may issue trading halts on specific securities or derivatives, which will affect the ability of the Fund to buy or sell certain securities or derivatives. In such circumstances, the Fund may be unable to rebalance its portfolio or accurately price its investments and may incur substantial trading losses.
Shares also may trade on the Exchange or on other markets at prices below their NAV. The NAV of shares will fluctuate with changes in the market value of the Fund’s holdings and the exchange-traded prices of the Fund's shares may not reflect these market values. Although the Fund’s shares are currently listed on the Exchange, there can be no assurance that an active trading market for shares will develop or be maintained.
Industry Concentration Risk—The Fund may concentrate its investments in a limited number of issuers conducting business in the same industry or group of related industries. As a result, the Fund is more vulnerable to adverse market, economic, regulatory, political or other developments affecting such industry or group of industries than a fund that invests its assets more broadly. As of December 28, 2017, the Underlying Index components, and thus the Fund's investments, are concentrated (i.e., 25% or more of its assets) in securities issued by companies in the industries or groups of industries described below. The industries and groups of industries in which the Underlying Index components, and thus the Fund's investments, may be concentrated will vary as the composition of the Underlying Index changes over time.
Electric Utilities Industry and Multi-Utilities Industry. As a result of the Fund's concentration in the Electric Utilities Industry and the Multi-Utilities Industry, the Fund will be more susceptible to the risks associated with those industries than a fund that does not concentrate its investments. The prices of securities in the Electric Utilities Industry and Multi-Utilities Industry may fluctuate significantly due to supply and demand, governmental regulation and environmental issues, economic conditions generally affecting electric and utilities companies, competitive pressures due to deregulation in the electric and utilities industries, increased sensitivity to the cost of energy production; and environmental factors such as conservation of natural resources or pollution control. Legislative or regulatory changes and increased government supervision may also affect companies in the utilities industry. The Electric Utilities Industry and Multi-Utilities Industry are separate industries comprising the Utilities Sector.
Large-Capitalization Securities Risk—The Fund is subject to the risk that large-capitalization stocks may underperform other segments of the equity market or the equity market as a whole. Larger, more established companies may be unable to respond quickly to new competitive challenges such as changes in technology and may not be able to attain the high growth rate of smaller companies, especially during extended periods of economic expansion.
Liquidity and Valuation Risk—In certain circumstances, it may be difficult for the Fund to purchase and sell a particular investment within a reasonable time at a fair price, or the price at which it has been valued by the Advisor for purposes of the Fund’s NAV, causing the Fund to be less liquid. While the Fund intends to invest in liquid securities and financial instruments, under certain market conditions, such as when trading in a particular investment has been halted temporarily by an exchange because the maximum price change of that investment has been realized, it may be difficult or impossible for the Fund to liquidate such investments. In addition, the ability of the Fund to assign an accurate daily value to certain investments may be difficult, and the Advisor may be required to fair value the investments.
Market Risk—The market value of the securities and derivatives (if any) held by the Fund may fluctuate over time in response to factors affecting individual companies or other factors such as changing economic, political or financial market conditions.
3 | SUMMARY PROSPECTUS
Non-Diversification Risk—The Fund is considered non-diversified and can invest a greater portion of its assets in securities of individual issuers than a diversified fund. As a result, changes in the market value of a single issuer's securities could cause greater fluctuations in the value of Fund shares than would occur in a diversified fund.
Passive Investment Risk—The Fund is not actively managed and the Advisor does not attempt to take defensive positions in declining markets. Therefore, the Fund may be subject to greater losses in a declining market than a fund that is actively managed.
Sector Risk—The Fund is subject to the Sector Risks described below.
Telecommunication Services Sector and Utilities Sector Risk. The Fund's investments are exposed to issuers conducting business in the Telecommunication Services Sector and Utilities Sector. The Telecommunication Services Sector includes includes companies that provide communications services primarily through a fixed-line, cellular or wireless, high bandwidth and/or fiber optic cable network. The Utilities Sector comprises utility companies such as electric, gas and water utilities. It also includes independent power producers & energy traders and companies that engage in generation and distribution of electricity using renewable sources. The Fund is subject to the risk that the securities of such issuers will underperform the market as a whole due to legislative or regulatory changes, adverse market conditions and/or increased competition affecting the Telecommunication Services Sector and Utilities Sector. The prices of the securities of companies operating in the Telecommunication Services Sector and Utilities Sector are closely tied to government regulation and market competition.
PERFORMANCE INFORMATION
The following bar chart shows the performance of the shares of the Fund from year to year. The variability of performance over time provides an indication of the risks of investing in the Fund. The following table shows the performance of the shares of the Fund as an average over different periods of time in comparison to the performance of the Underlying Index and the S&P 500® Index Utilities Total Return, which is the market capitalization weighted version of the Underlying Index. The figures in the bar chart and table assume the reinvestment of dividends and capital gains distributions. Of course, this past performance (before and after taxes) does not necessarily indicate how the Fund will perform in the future.
Updated performance information is available on the Fund’s website at guggenheiminvestments.com or by calling 800.820.0888.
The performance information shown below is based on a calendar year.
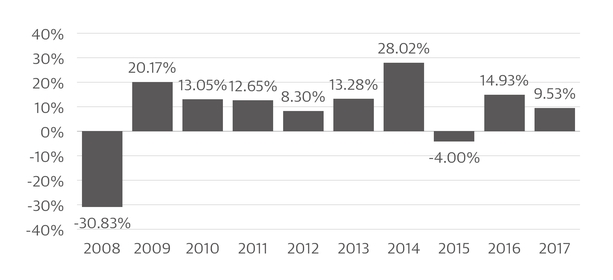
Highest Quarter Return | Lowest Quarter Return | |||
Q1 2016 | 15.63% | Q3 2008 | -14.93% | |
SUMMARY PROSPECTUS | 4
AVERAGE ANNUAL TOTAL RETURN (for periods ended December 31, 2017)
The after-tax returns presented in the table below are calculated using highest historical individual federal marginal income tax rates and do not reflect the impact of state and local taxes. Your actual after-tax returns will depend on your specific tax situation and may differ from those shown below. After-tax returns are not relevant to investors who hold shares of the Fund through tax-deferred arrangements, such as 401(k) plans or individual retirement accounts (“IRAs”).
Past 1 Year | Past 5 Years | Past 10 Years | |
Return Before Taxes | 9.53% | 11.87% | 7.23% |
Return After Taxes on Distributions | 8.07% | 10.24% | 5.74% |
Return After Taxes on Distributions and Sale of Fund Shares | 5.38% | 8.59% | 5.00% |
S&P 500® Equal Weight Index Telecommunication Services & Utilities Total Return (reflects no deduction for fees, expenses or taxes) | 9.95% | 12.36% | 7.76% |
S&P 500® Index Utilities Total Return (reflects no deduction for fees, expenses or taxes) | 12.11% | 12.62% | 6.31% |
MANAGEMENT
INVESTMENT ADVISOR
Security Investors, LLC, which operates under the name Guggenheim Investments, serves as the investment adviser of the Fund.
PORTFOLIO MANAGERS
• | Michael P. Byrum, CFA, Senior Vice President. Mr. Byrum has been associated with the Advisor since it was founded in 1993. |
• | James R. King, CFA, Portfolio Manager. With the exception of the period from March 15, 2008 to January 18, 2011, Mr. King has been associated with the Advisor since 1996. From March 15, 2008 to January 18, 2011, Mr. King served as a hedge fund consultant. |
• | Ryan A. Harder, CFA, Portfolio Manager. Mr. Harder has been associated with the Advisor since 2004. |
PURCHASE AND SALE OF FUND SHARES
Shares may be purchased and redeemed from the Fund only in “Creation Units” of 50,000 shares, or multiples thereof. As a practical matter, only institutions and large investors, such as market makers or other large broker-dealers, purchase or redeem Creation Units. Most investors will buy and sell shares of the Fund on the Exchange. Individual shares can be bought and sold throughout the trading day like other publicly traded securities through a broker-dealer on the Exchange. These transactions do not involve the Fund. The price of an individual Fund share is based on market prices, which may be different from its NAV. As a result, the Fund’s shares may trade at a price greater than the NAV (at a premium) or less than the NAV (at a discount). Most investors will incur customary brokerage commissions and charges when buying or selling shares of the Fund through a broker-dealer on the Exchange.
TAX INFORMATION
Fund distributions are generally taxable as ordinary income, qualified dividend income or capital gains (or a combination thereof), unless your investment is in an IRA or other tax-advantaged retirement account. Investments through a tax-advantaged retirement account may be subject to taxation upon withdrawal.
PAYMENTS TO BROKER-DEALERS AND OTHER FINANCIAL INTERMEDIARIES
If you purchase Fund shares through a broker-dealer or other financial intermediary (such as a bank), the Fund and its related companies may pay the intermediary for the sale of Fund shares and related services. These payments may create a conflict of interest by influencing the broker-dealer or other intermediary and your sales person to
5 | SUMMARY PROSPECTUS
recommend the Fund over another investment. Ask your sales person or visit your financial intermediary’s website for more information.
SUMMARY PROSPECTUS | 6
Serious News for Serious Traders! Try StreetInsider.com Premium Free!
You May Also Be Interested In
- NV Gold Announces Secured Loan Terms
- Sandata Opposes Singular Fiscal Intermediary to Manage Care In New York
- TabaPay to Acquire the Assets of Synapse Financial Technologies, Inc.
Create E-mail Alert Related Categories
SEC FilingsSign up for StreetInsider Free!
Receive full access to all new and archived articles, unlimited portfolio tracking, e-mail alerts, custom newswires and RSS feeds - and more!
