The Reason behind Tata Motors’ Complaint against Jiangling Motors
Price movement of Tata Motors Tata Motors (TTM) has a market cap of $22.1 billion. It rose by 0.32% to close at $34.28 per share on June 3, 2016. The stock’s weekly, monthly, and year-to-date (or YTD) price movements were 15.3%, 20.8%, and 16.3%, respectively, as of the same day. This means that TTM is […]
Jun. 6 2016, Published 12:59 p.m. ET

Price movement of Tata Motors
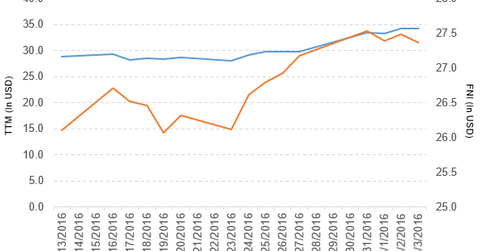
Tata Motors (TTM) has a market cap of $22.1 billion. It rose by 0.32% to close at $34.28 per share on June 3, 2016. The stock’s weekly, monthly, and year-to-date (or YTD) price movements were 15.3%, 20.8%, and 16.3%, respectively, as of the same day. This means that TTM is trading 15.5% above its 20-day moving average, 15.7% above its 50-day moving average, and 25.3% above its 200-day moving average.
Related ETF and peers
The First Trust ISE Chindia ETF (FNI) invests 3.5% of its holdings in Tata Motors. The ETF tracks an index of stocks from China and India screened by market cap and weighted in tiers. The YTD price movement of FNI was -3.5% as of June 3, 2016.
The market caps of Tata Motors’ competitors are as follows:
Why Tata Motors sued Jiangling Motors
Tata Motors’ Jaguar Land Rover has sued Jiangling Motors in a Chinese court over copyright and unfair competition. Jiangling Motors’ Landwind X7 sport utility vehicle looks like the Land Rover Evoque in some features such as similar broad fenders, recessed door panels, and a sloping roof.
Performance of Tata Motors in fiscal 4Q16 and fiscal 2016
Tata Motors reported fiscal 4Q16 total income from operations of 806.8 billion Indian rupees. That’s an increase of 19.0% compared to total income from operations of 677.8 billion rupees in fiscal 4Q15. Revenue from Tata and other brand vehicles and financing for the Jaguar and Land Rover automotive segments rose by 22.9% and 18.2%, respectively, in fiscal 4Q16, compared to fiscal 4Q15.
Tata Motors’ net income, EPS (earnings per share) of ordinary shares, and EPS of class A ordinary shares rose to 52.1 billion rupees, 15.2 rupees, and 15.3 rupees, respectively, in fiscal 4Q16. This compares to 17.5 billion rupees, 5.3 rupees, and 5.4 rupees, respectively, in fiscal 4Q15.
Fiscal 2016 results
In fiscal 2016, Tata Motors reported total income from operations of 2.8 trillion rupees, a rise of 4.7% year-over-year. Its net income, EPS of ordinary shares, and EPS of class A ordinary shares fell to 111.1 billion rupees, 32.6 rupees, and 32.7 rupees, respectively, in fiscal 2016. This compares to 140.6 billion rupees, 43.0 rupees, and 43.1 rupees, respectively, in fiscal 2015.
Tata Motors’ cash and bank balances and inventories rose by 2.4% and 14.1%, respectively, in fiscal 2016. Its current ratio rose to 1.04x, and its long-term debt-to-equity ratio fell to 0.95x in fiscal 2016, compared to 1.01x and 1.5x, respectively, in fiscal 2015.
In the next and final part of this series, we’ll take a look at Pilgrim’s Pride.
